QQQ: Correction Canceled?
Three deleveraging signals, a historical rotation pattern, and the exact level that breaks the bullish case.
In last week’s edition, we lined up some clear conditions for QQQ to end its correction, as well as a scenario for further downside, if the week closes below the yellow 21 EMA. Throughout the week, we had conclusive price action (in the truest sense of the word).
For the full reasoning behind the corrective targets, check out last week’s edition of Weekly Open below.

Key Takeaways:
Weekly 21 EMA held; correction thesis intact unless QQQ closes below it or breaks last week’s low.
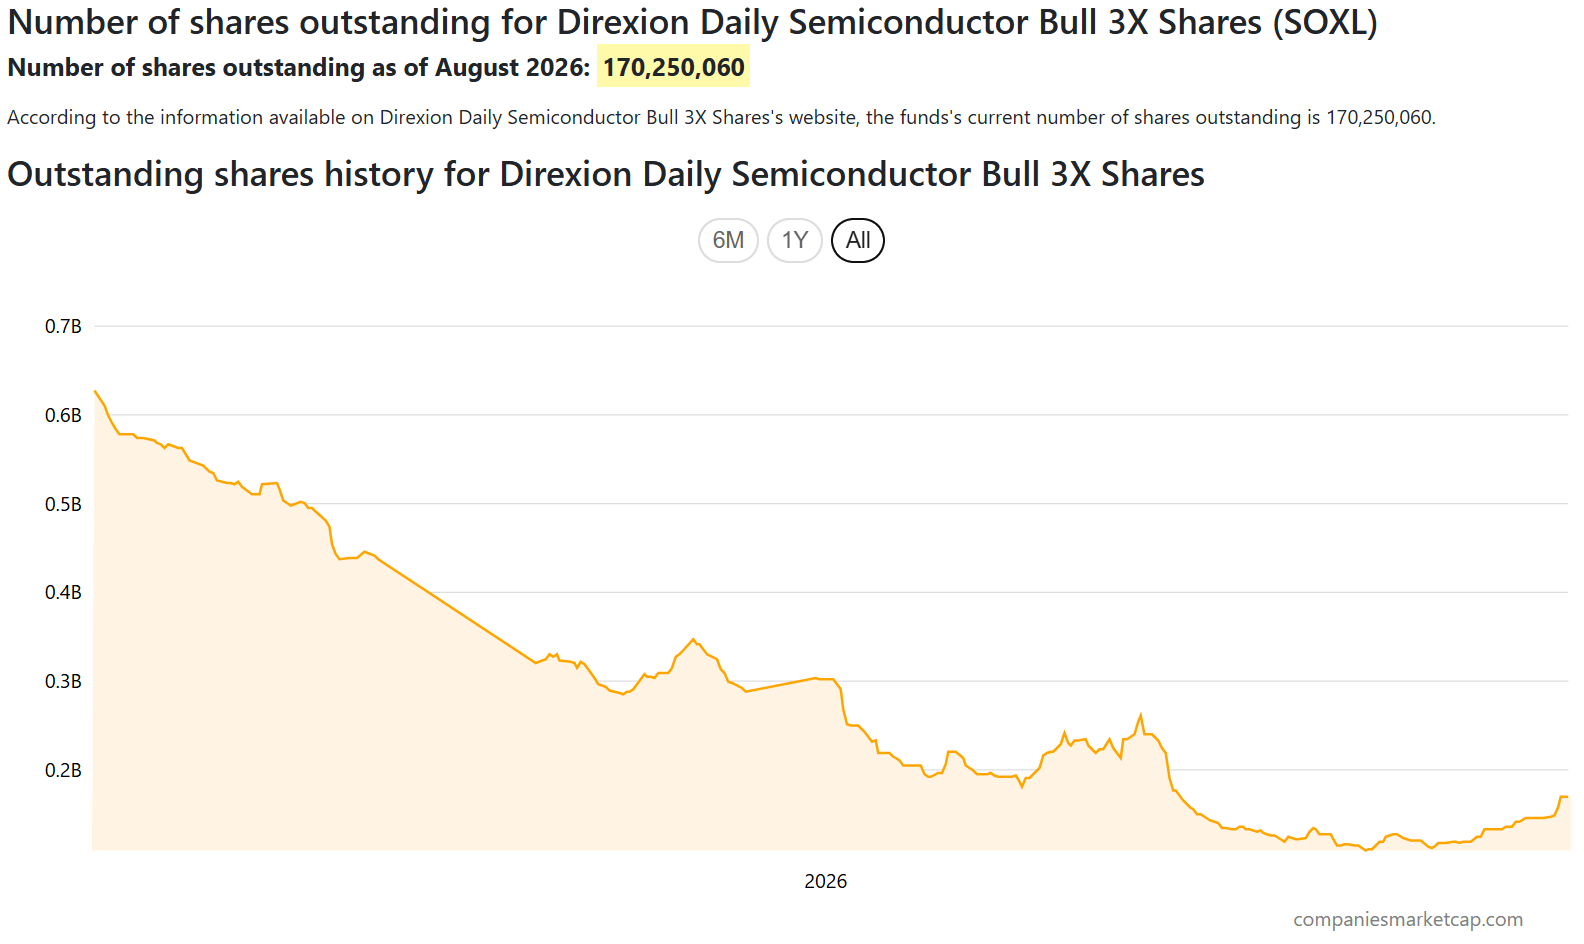
Deleveraging evidence (Aschenbrenner liquidation, ~320,000–360,000 South Korean retail accounts, falling SOXL volume) supports a low being close.
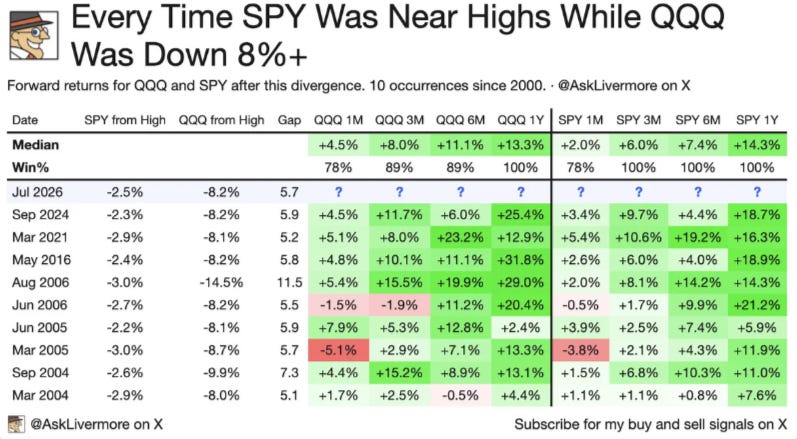
Historical pattern: in 7 of 9 prior QQQ/SPY divergence events, QQQ’s 3M forward return exceeded SPY’s.
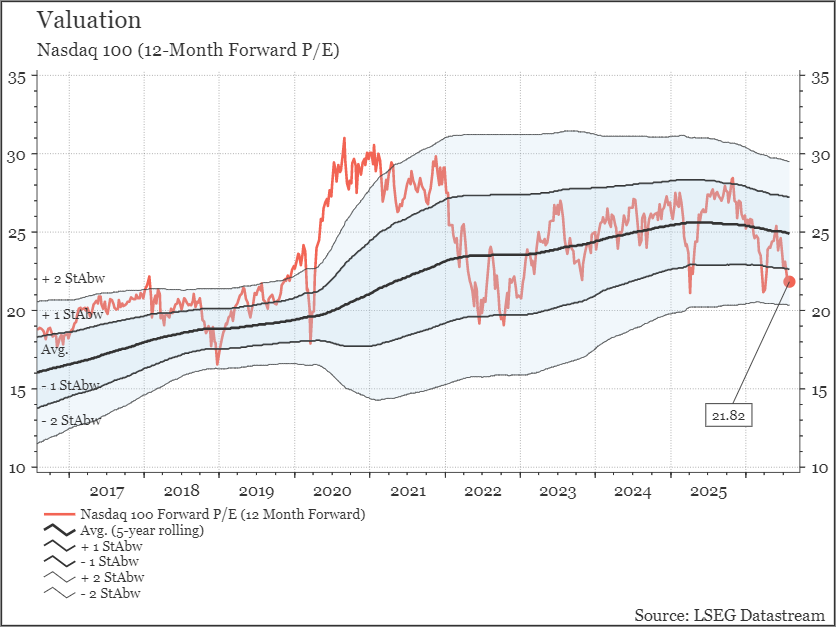
Nasdaq 100 forward P/E sits below its 5-year average, supporting the low-is-close case.
No Weekly Closure Below The 21 EMA
That was our condition for initiating deeper pullback targets around the 55 EMA, based on the weekly MACD Cross. Instead, we have seen a strong intraweek move below the 21 EMA, which has been bought back up almost entirely, forcing the week to close slightly positive. I will run with the assumption that last week has been the low, unless QQQ closes below the 21 EMA on the weekly timeframe or trades below last week’s low.
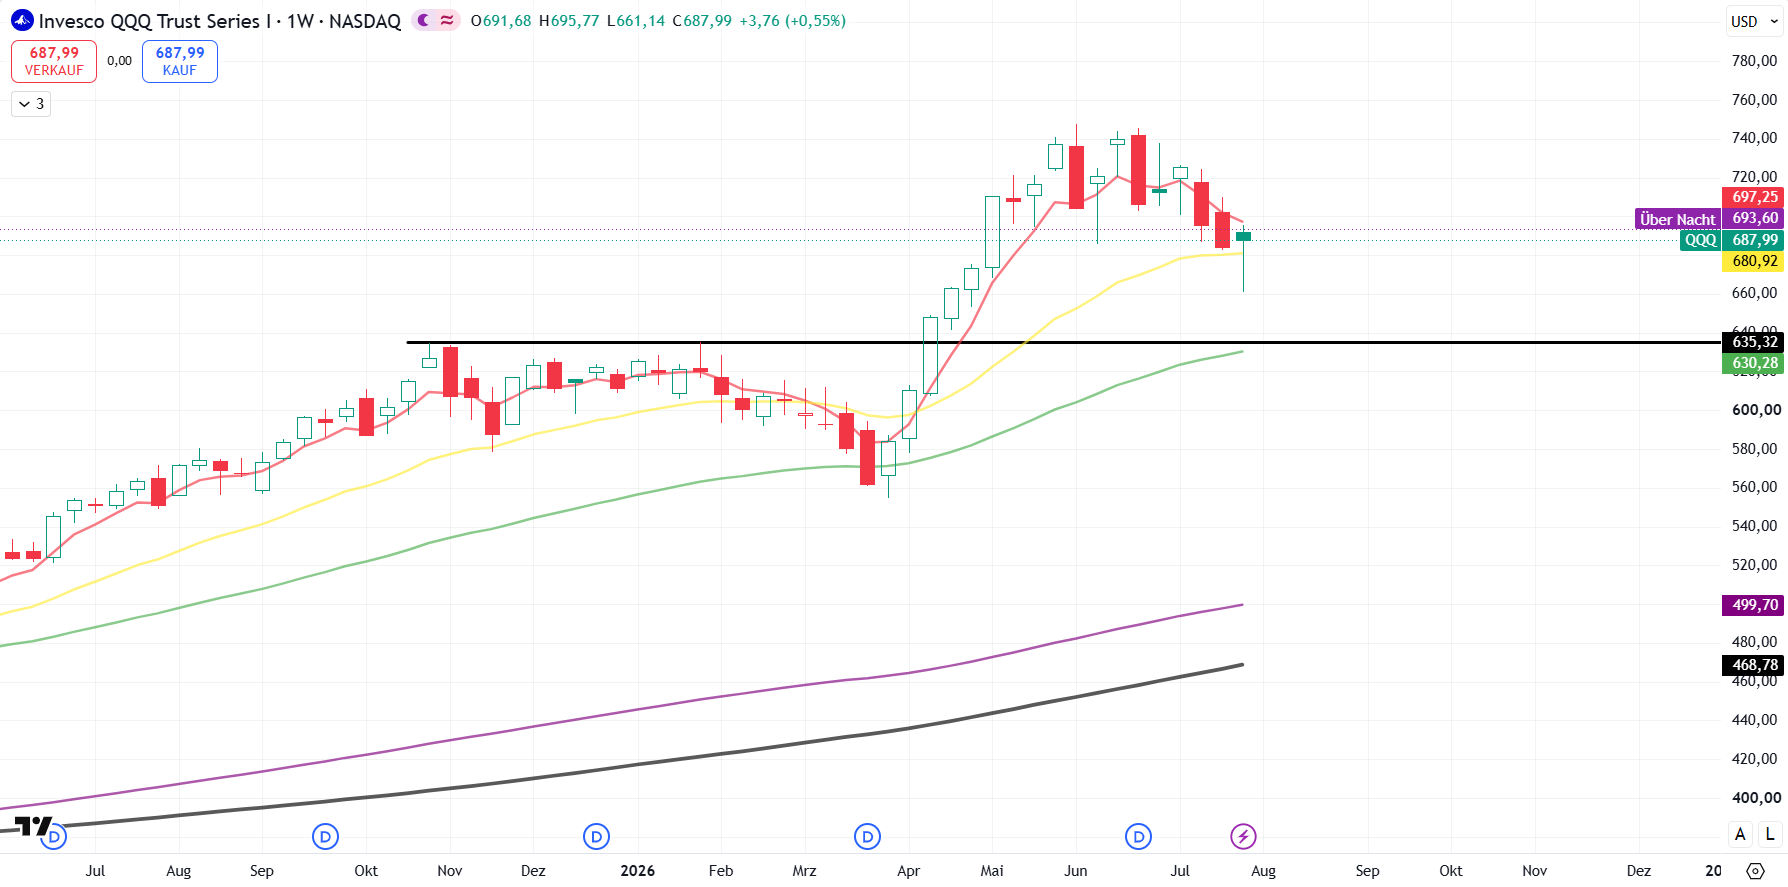
If there is a weekly closure below the 21 yellow EMA or an intraweek move below last week’s low, I’d expect our corrective targets from last week to come into play.
Beautiful Deleveraging: Is The Low In?
There has been a lot of news that suggests technology might be close to a low. A lot of leverage has been taken out of the system as of last week:
Aschenbrenner’s Hedge Fund “Situational Awareness” getting liquidated on his wedding day (yikes).
Approx. 320,000 - 360,000 retail accounts in South Korea have been liquidated since the correction in the Chip Sector began in June (estimated by Citibank).
Leveraged ETF Volume in the US has meaningfully declined (e.g., SOXL ETF Volume).
The End Of The Defensive Rotation?
Kudos to AskLivermore on X for bringing up the statistic below.
The table below shows subsequent returns if QQQ meaningfully corrects, while SPY is hanging in at the highs.
I think this statistic is interesting for more than one reason:
a) I like to be bullish, and this setup confirms my bias.
b) During 7/9 iterations, the following 3M return of QQQ was larger than SPY.
As I have pointed out in previous editions of weekly open, I’d expect the defensive rotation we have been covering throughout the last weeks to end once QQQ has put in its lows and continues its overall uptrend.
Valuation
Valuations are currently supporting the case for a low being close. The current forward P/E is close to the lows of common corrections in recent years. Valuations for the Nasdaq 100 are currently below its 5-year average of approx. 25x forward P/E.
Last week’s price action has been a great example of why I embrace systematic trading approaches (ideally automated): I personally would have thought that a correction might go deeper; however, the mean-reversion system executed regardless of my opinion and opened three positions against my personal idea.
The Strategy does not care about my thesis; it simply executes based on a set of rules.
If you want the full breakdown of the Mean-Reversion Strategy that bought the Thursday’s open last week on EEM, QQQ, SPY check out the article below:

Stay Sharpe,
N
🔓 Paid Members Unlock 🔓
📊Full Access to the TPTP Dashboard: Trade like a quant. Every Strategy tracked live and out-of-sample. Verify performance, holdings, risk metrics, updated daily.
🔓The Strategy Archive: Every past Deep-Dive, including the full logic, code, and thesis, is now completely open for you.
📈The Full Deep-Dive: You will receive the full Strategy Deep Dive directly in your inbox, including full source code, backtest, and optimized parameters.
🤝The Pit Substack Channel: Be a part of our private Substack Chat. This is a place to exchange ideas, co-develop strategies, discuss new concepts, talk trade automation, troubleshoot existing setups, or simply chat about life and make friends.
Risk Disclosure & Disclaimer: This publication is for informational and educational purposes only. The content provided does not constitute financial advice, investment recommendations, or an invitation to buy or sell any securities or financial instruments. Trading in financial markets, particularly with leveraged products, involves significant risk and is not suitable for every investor.
Historical backtested results are no guarantee of future performance. You trade at your own risk. The author assumes no liability for any losses or damages resulting directly or indirectly from the use of the strategies or codes published here. The code is provided as is, without any warranty.
Please keep your individual risk tolerance in mind. Backtested results are limited in their ability to understand a strategy’s risk profile and do not reflect real market conditions. If you are using leverage or futures contracts, be aware of the fact that you can lose more than the amount you have initially invested. Before implementation, consulting with a certified investment advisor is strongly recommended.