Your Dashboard Just Got a Third Engine
The Selling Climax setup from last quarter's research has been added to the TPTP Dashboard. Live-monitoring positioning and performance included.
Key Summary:
A third strategy, Selling Climax Mean Reversion, is now live on the Dashboard alongside 12-1 Sector Momentum and Combined Momentum.
Free readers get the mechanism. Paid subscribers get the live status, position sizing, stop levels, and full trade history.
The 200-day regime filter is a toggle: flip it, and every metric on the tab recalculates, live, for you.
Care to try it out? Grab your 7-Day Free Trial, no strings attached.
Adding a Mean-Reversion Engine to our Dashboard
One of our most popular strategy articles will now get live oos-testing in a paper environment, live for you to follow.
Choose between 5 liquid ETFs: EEM, QQQ, SPY, TLT, ACWI
Analyze avg. trade statistics, yearly performance heatmap, the last 30 trades
Receive live positioning, including a banner flagging whether the strategy will take a trade at the next open
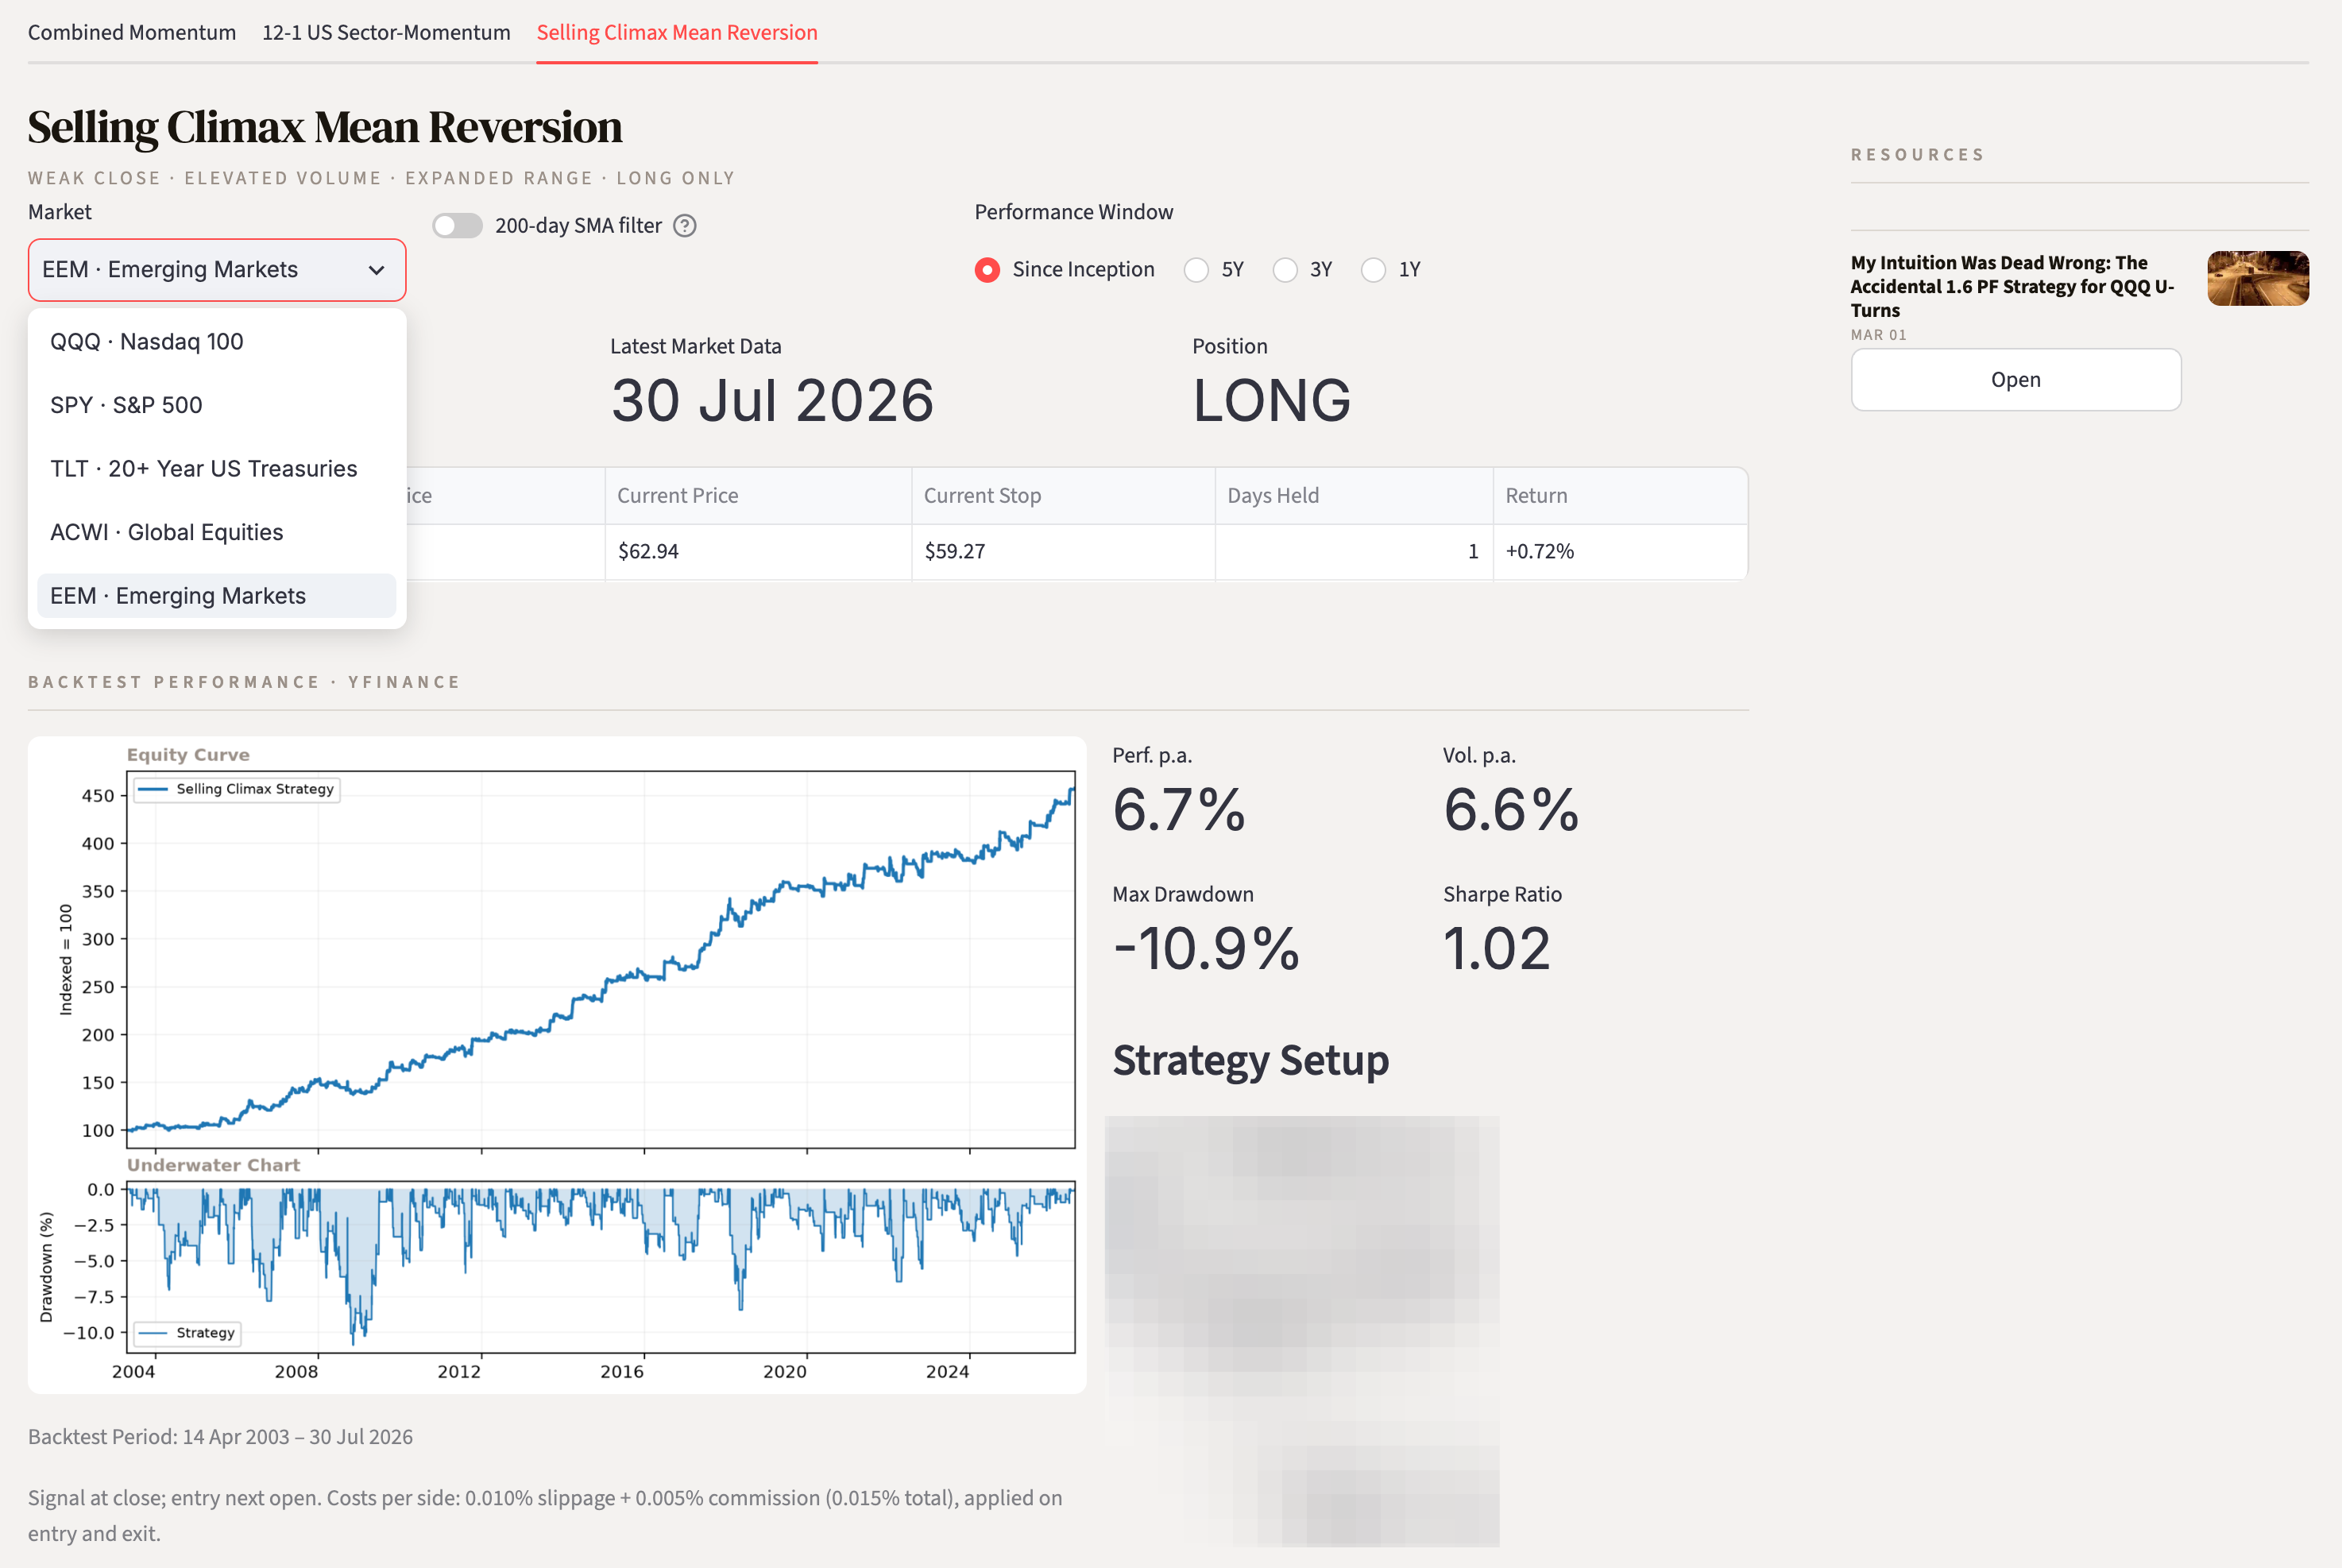
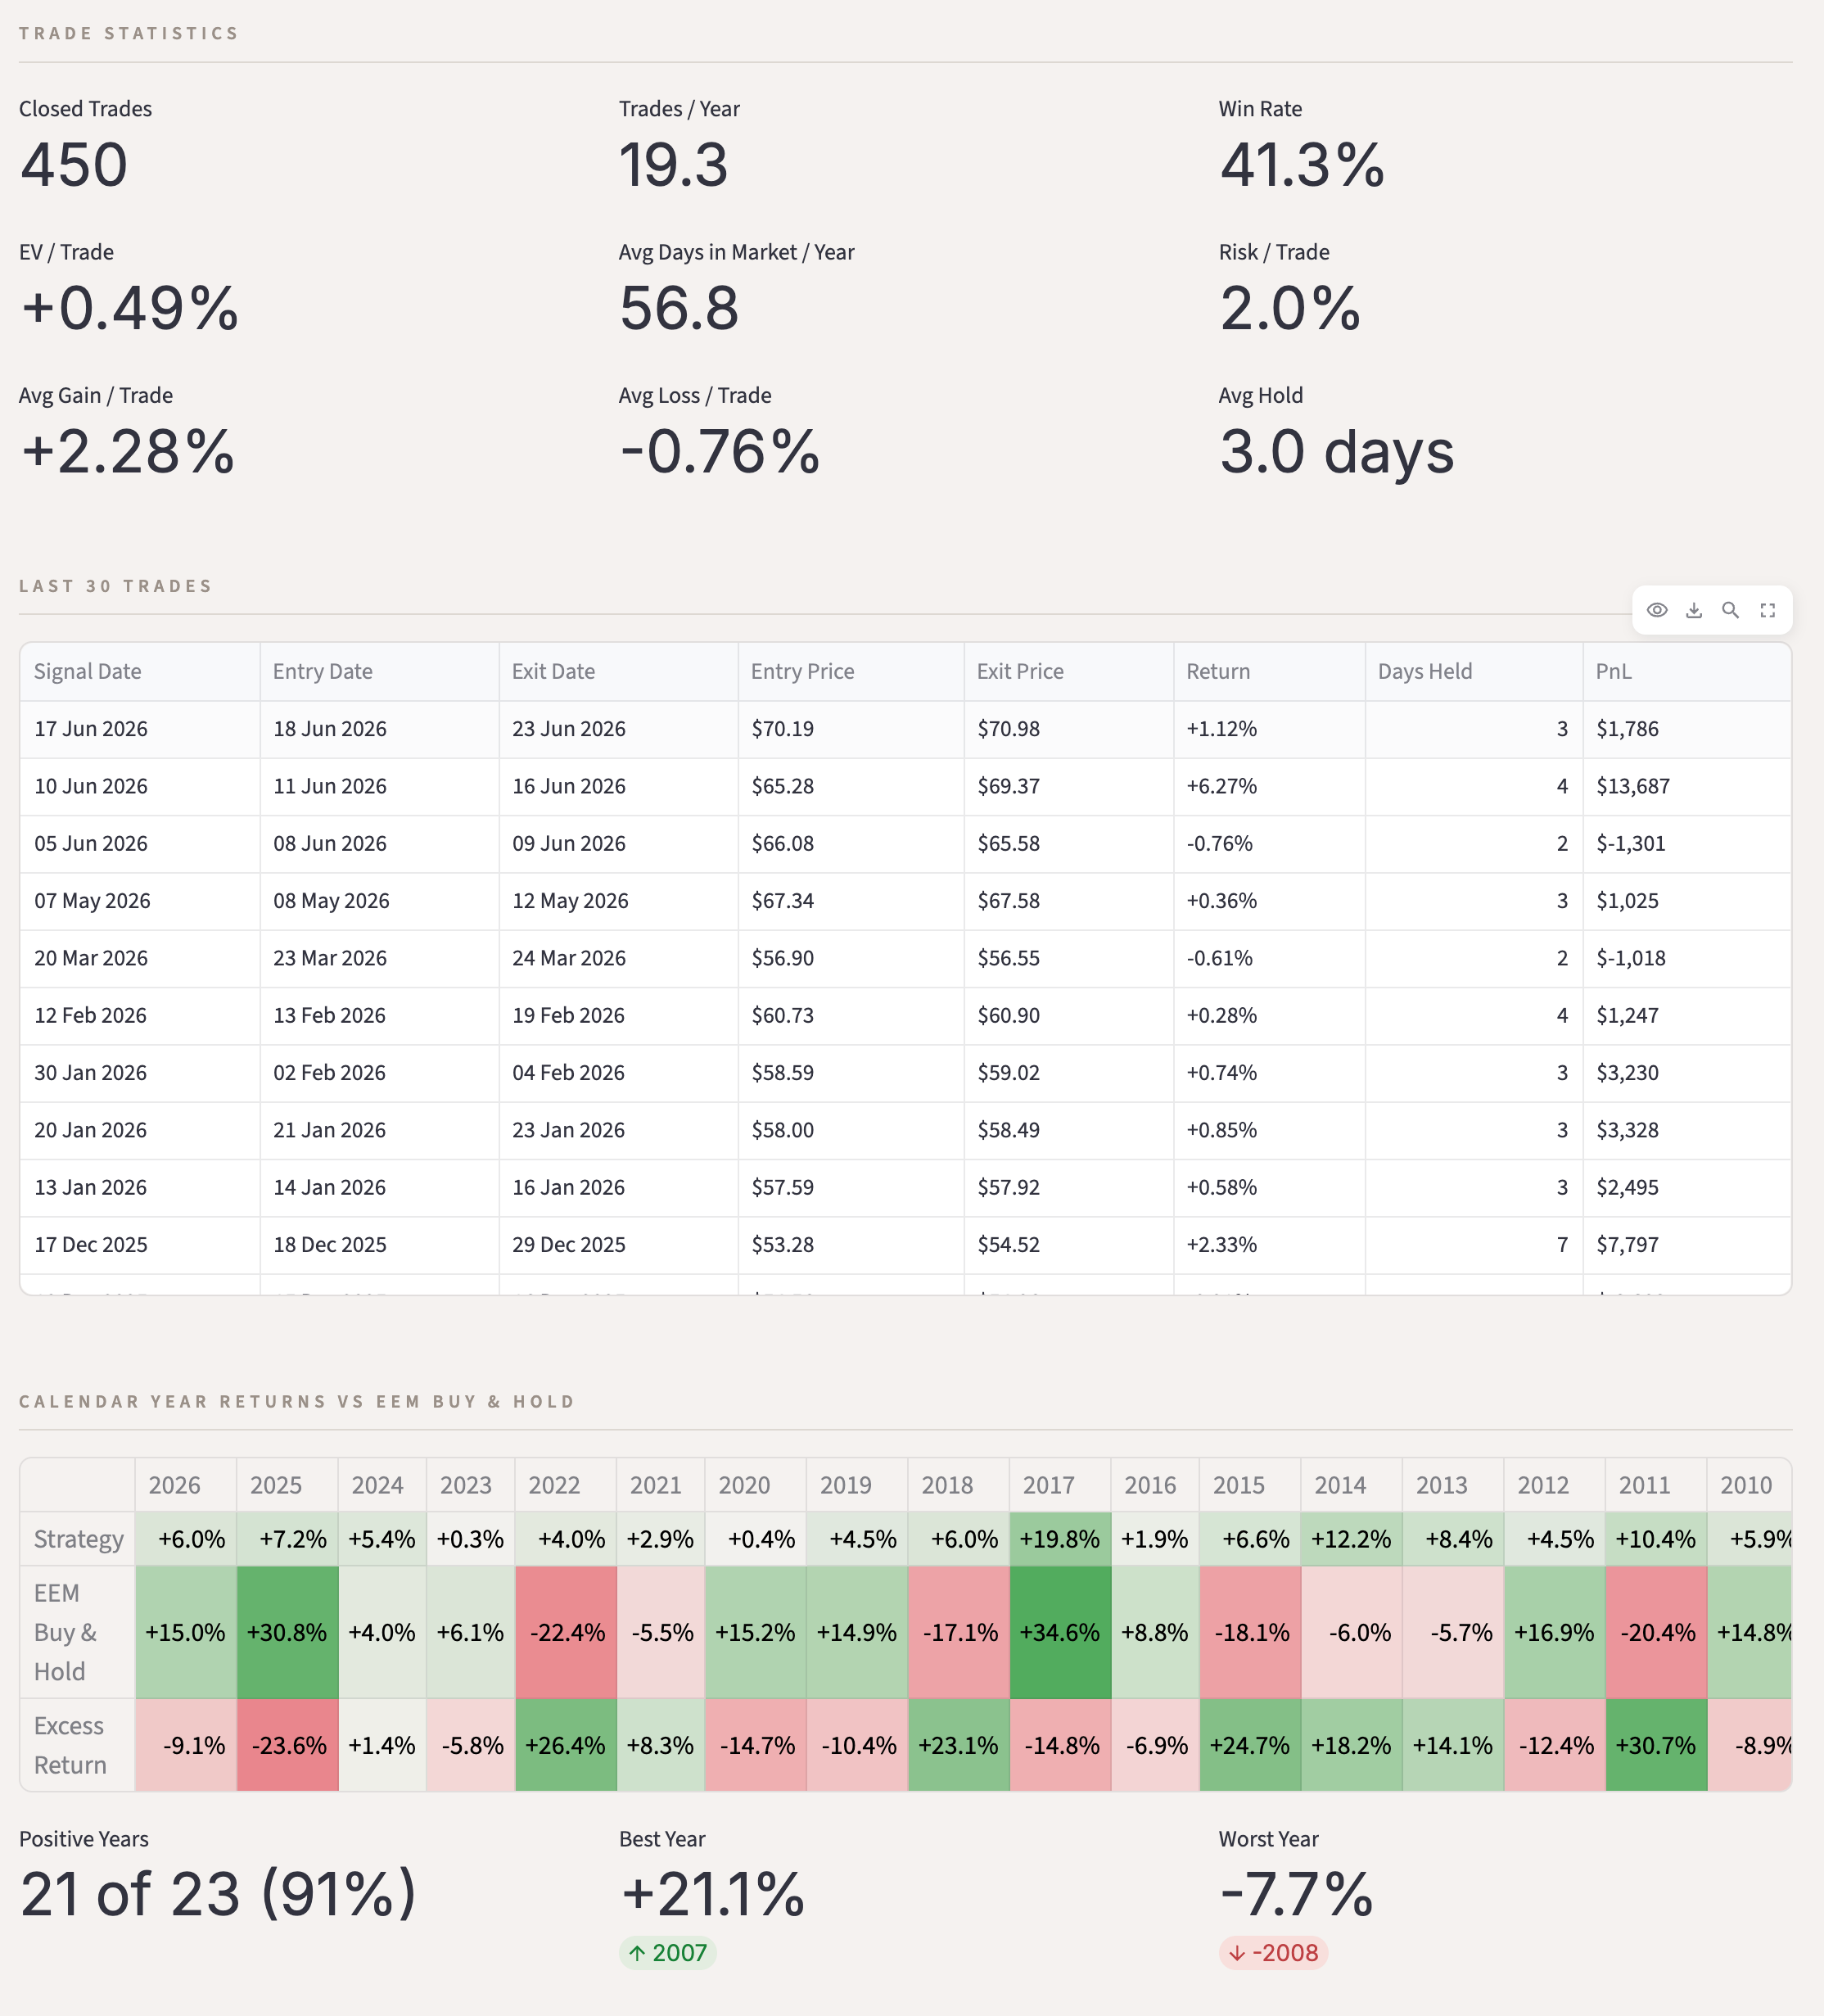
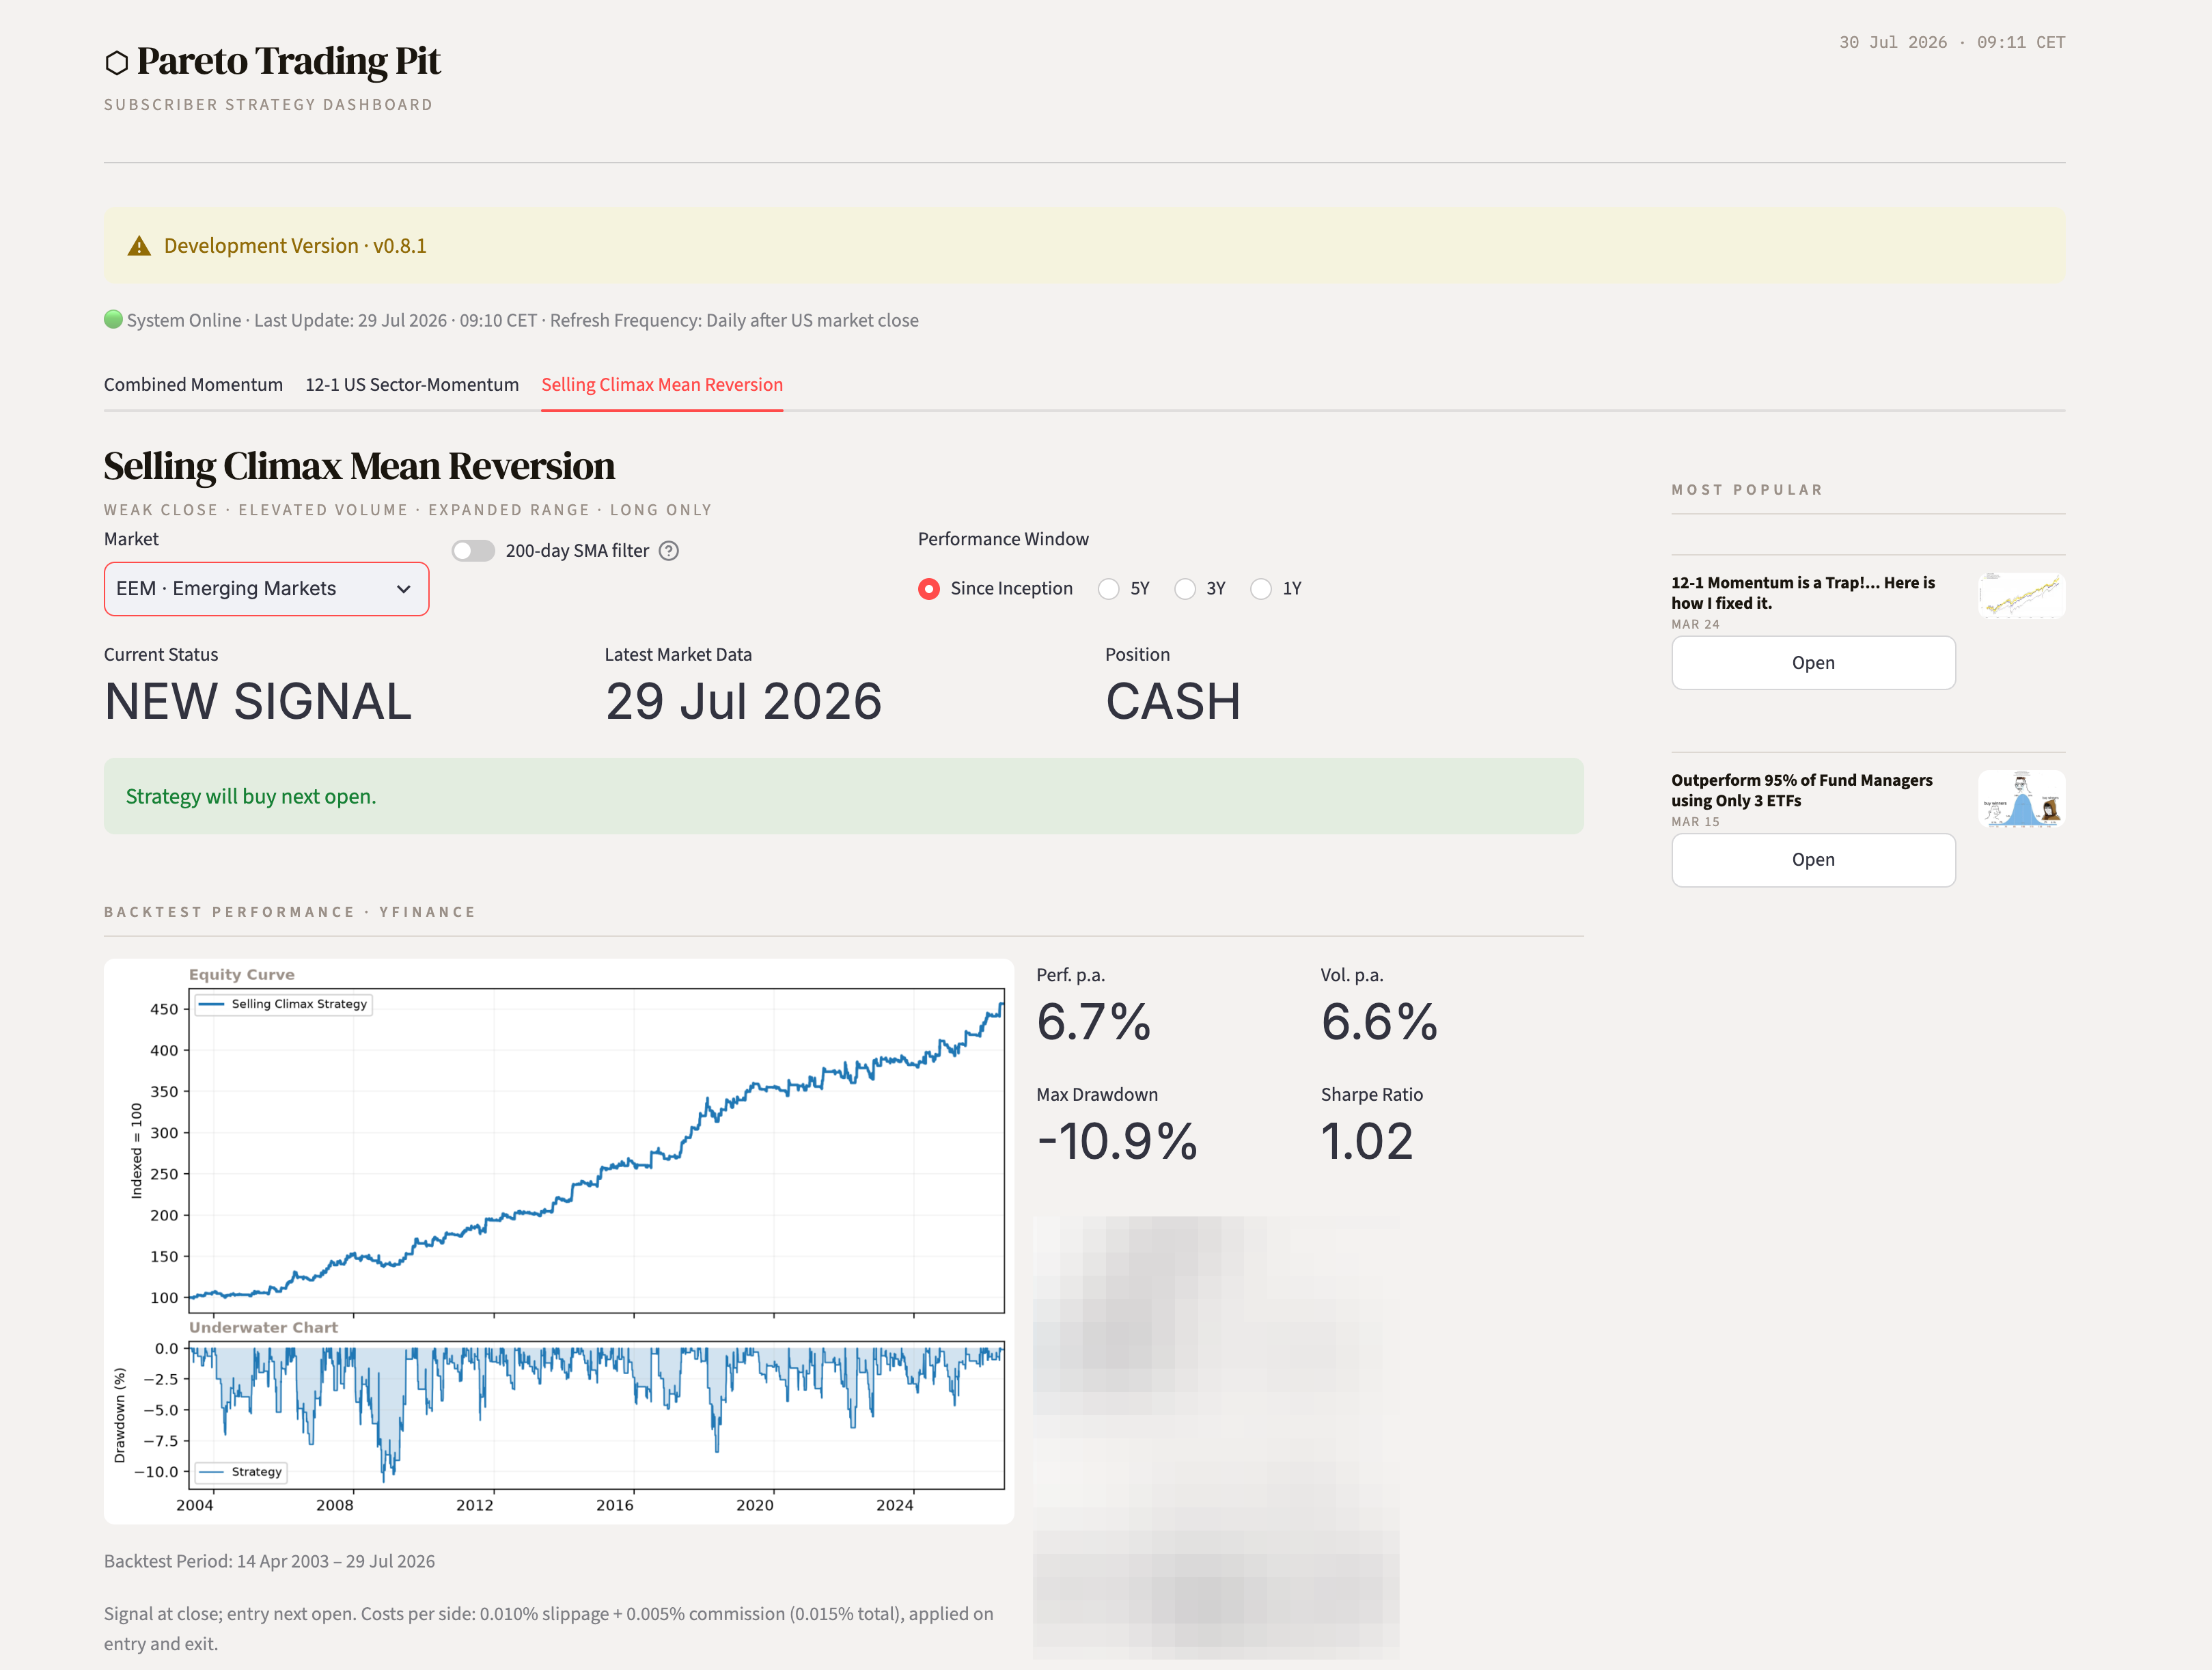
I really hated the idea, of building a strategy, just to put it out there without anyone putting them to use. With the dashboard, we will track live performance of our strategies in order to get a better understanding of their behaviour, how they work within a portfolio context and what to expect of them during different regimes.
Most of trading content is a lot of pretty backtests: The author posts a lot of strategies and moves on. They don’t really focus on whether what they created is actually useful to the readers or if the setup will fall apart afterwards. At TPTP we want to go deeper, identifying strengths, weaknesses and how the strategy works after the backtest, out-of-sample.
Reminder: What does the setup look like
For anyone who hasn’t read the original piece (or wants the refresher): the strategy watches for a specific combination of conditions on a single completed daily bar:
A weak close. The close sits in the bottom third of the day’s range. Sellers were still in control into the close.
Elevated volume. Volume above its 20-day average. This is what separates a genuinely crowded exit from an ordinary quiet red day.
A Secret Ingredient. Implying that the move actually stood out.
The code is assessing that information on a closing-basis and, if all criteria are met, opening a long position on the next open for the individual ticker.
Here is the link to our initial article, if you care to revisit the basic idea:

What’s live behind the paywall
The article gave you the hypothesis. The Dashboard tab gives you the operating system around it:
Live signal status. A clear state for each of the five markets: no setup, new setup (entry at next open), or already in position, along with entry price, current stop, days held, and running return.
Smart position sizing. Every entry risks a defined 2% of portfolio value, sized against an ATR-based stop distance. Wider stop, smaller position. No leverage, no more than 100% capital deployed at any time.
A trailing stop with a documented rule, not a black box. Initial stop is set at the signal day’s low minus the ATR. From there, the stop follows the prior day’s low, never below the initial level.
A regime filter for you to test. Toggle the 200-day trend filter on or off and watch the entire tab recalculate: equity curve, drawdowns, trade statistics, calendar-year returns, current signal status. You can validate, if that filter fits your process.
Full trade-level transparency. The last 30 closed trades, with entry and exit dates, prices, holding period, and modeled return. Costs included, at 0.010% slippage and 0.005% commission per side.
Backtest analytics across selectable windows. Annualized return, annualized volatility, max drawdown, Sharpe (0% risk-free rate), plus a calendar-year heatmap showing how much of the long-term result depended on a handful of strong years versus a broad base of positive ones.
Try it before you decide
The Dashboard, including all three strategies, is part of every paid subscription. If you’re on the free list and want to see whether Selling Climax earns a place in your process, the 7-day free trial gives you full access.
Stay Sharpe, N
Risk Disclosure & Disclaimer: This publication is for informational and educational purposes only. The content provided does not constitute financial advice, investment recommendations, or an invitation to buy or sell any securities or financial instruments. Trading in financial markets, particularly with leveraged products, involves significant risk and is not suitable for every investor.
Historical backtested results are no guarantee of future performance. You trade at your own risk. The author assumes no liability for any losses or damages resulting directly or indirectly from the use of the strategies or codes published here. The code is provided as is, without any warranty.
Please keep your individual risk tolerance in mind. Backtested results are limited in their ability to understand a strategy’s risk profile and do not reflect real market conditions. If you are using leverage or futures contracts, be aware of the fact that you can lose more than the amount you have initially invested. Before implementation, consulting with a certified investment advisor is strongly recommended.